Client
Omnus Law


Contact Me
Project Overview

Omnus Law’s Finance Team managed payouts for hundreds of attorneys using 50 separate Filevine accounts—exporting CSVs and wrangling spreadsheets for hours daily. I led the design of a unified Invoice & Partner Pool Dashboard that automated these processes and centralized data into a single, accurate ERP-style interface.
Omnus Law
Legal Sector
December 2024 - April 2025
Sole UX Designer
Cross-functional partnership between Engineering, Finance, and Operations


Problem
50 Accounts

Goal
1 Dashboard


Problem
3-4 hrs/day

Goal
~0.5 hr/day

Problem
Frequent Errors

Goal
Automated Checks


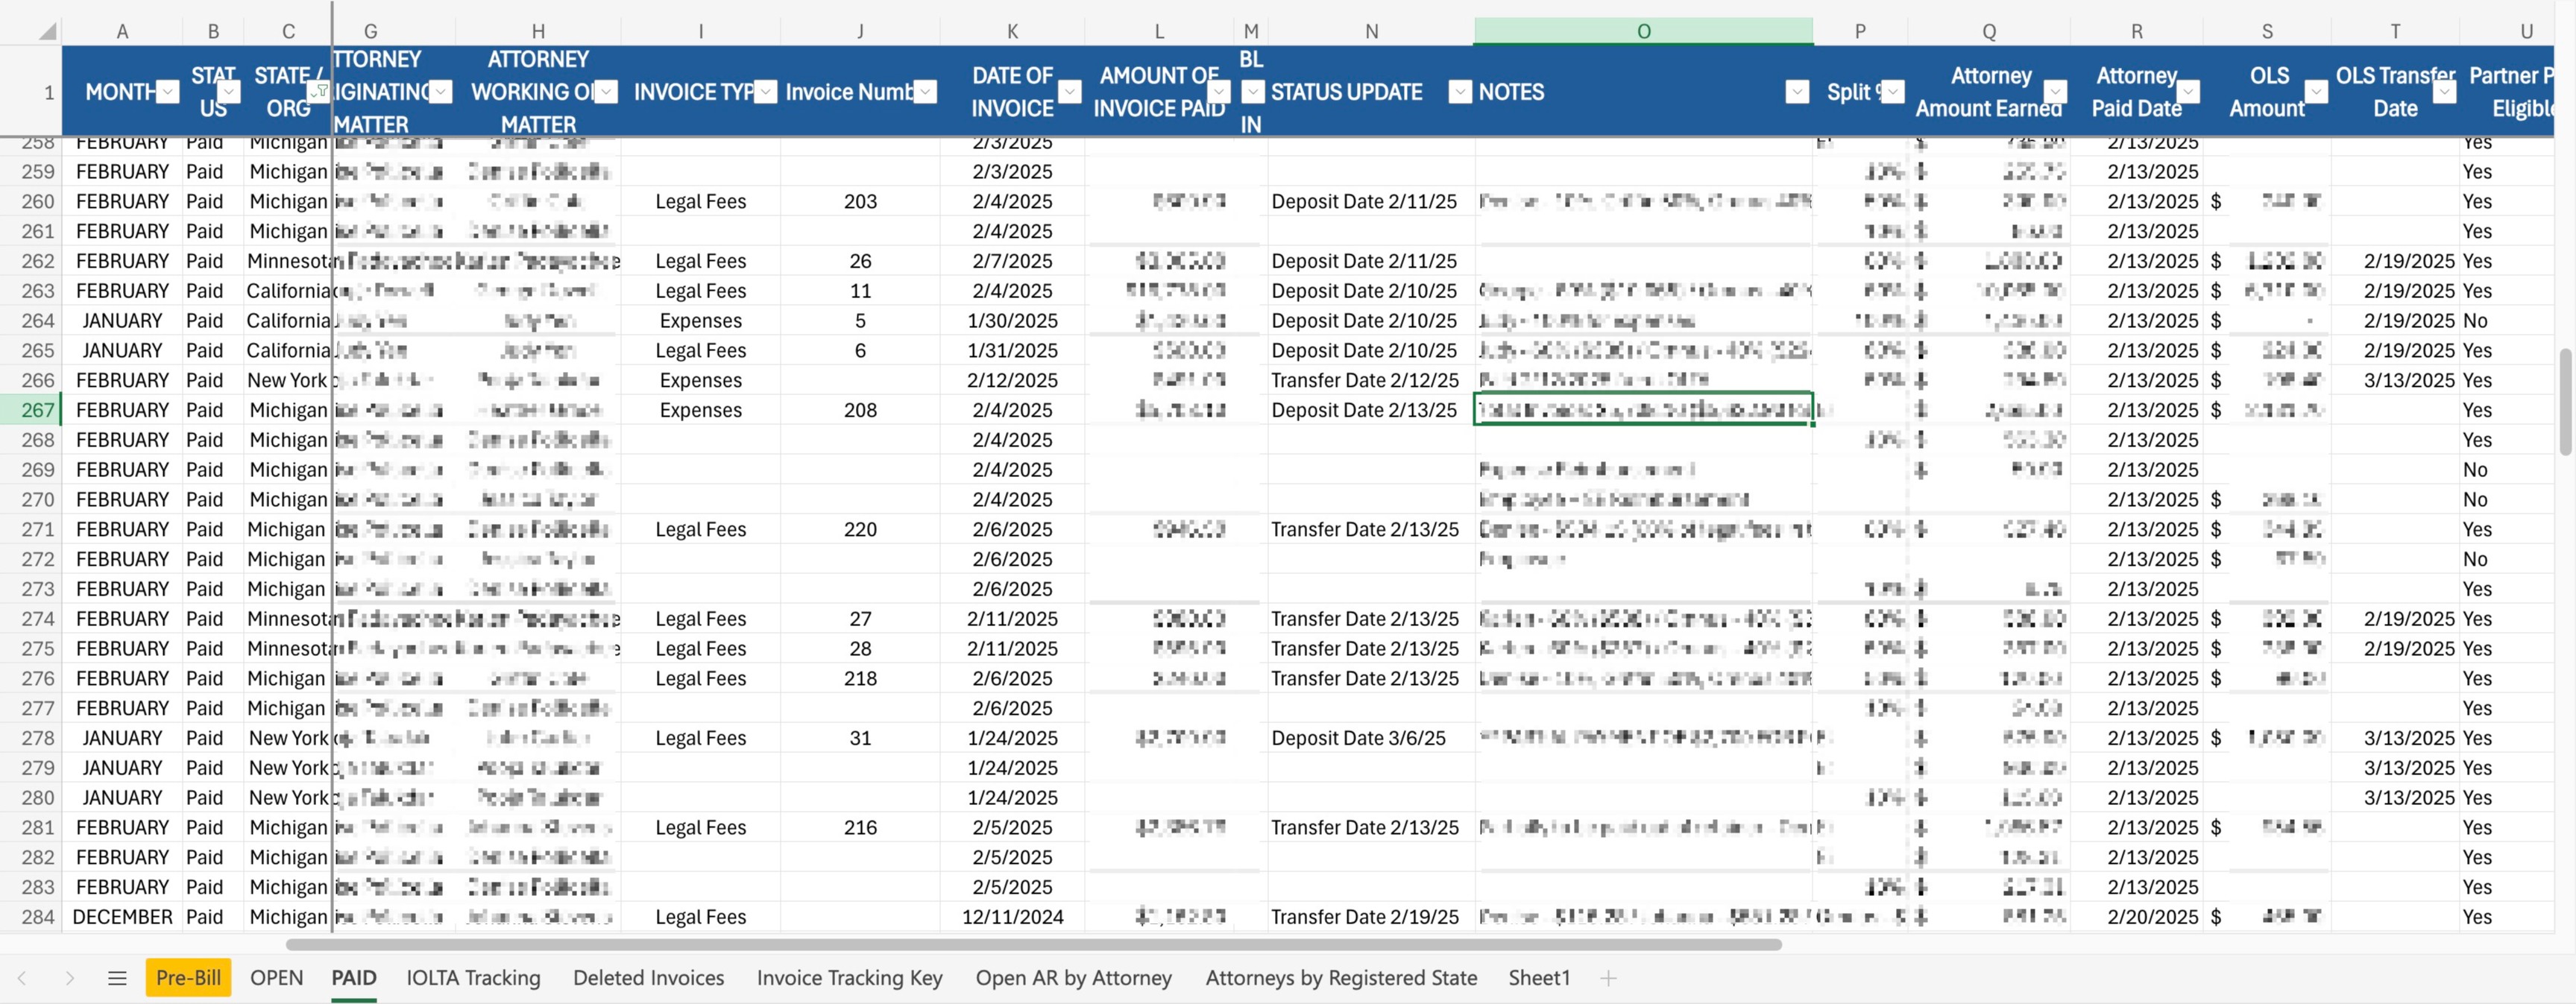
Spreadsheet for maintaining 50 Filevine accounts.
This confirmed the need for a centralized data source and automated payout logic.
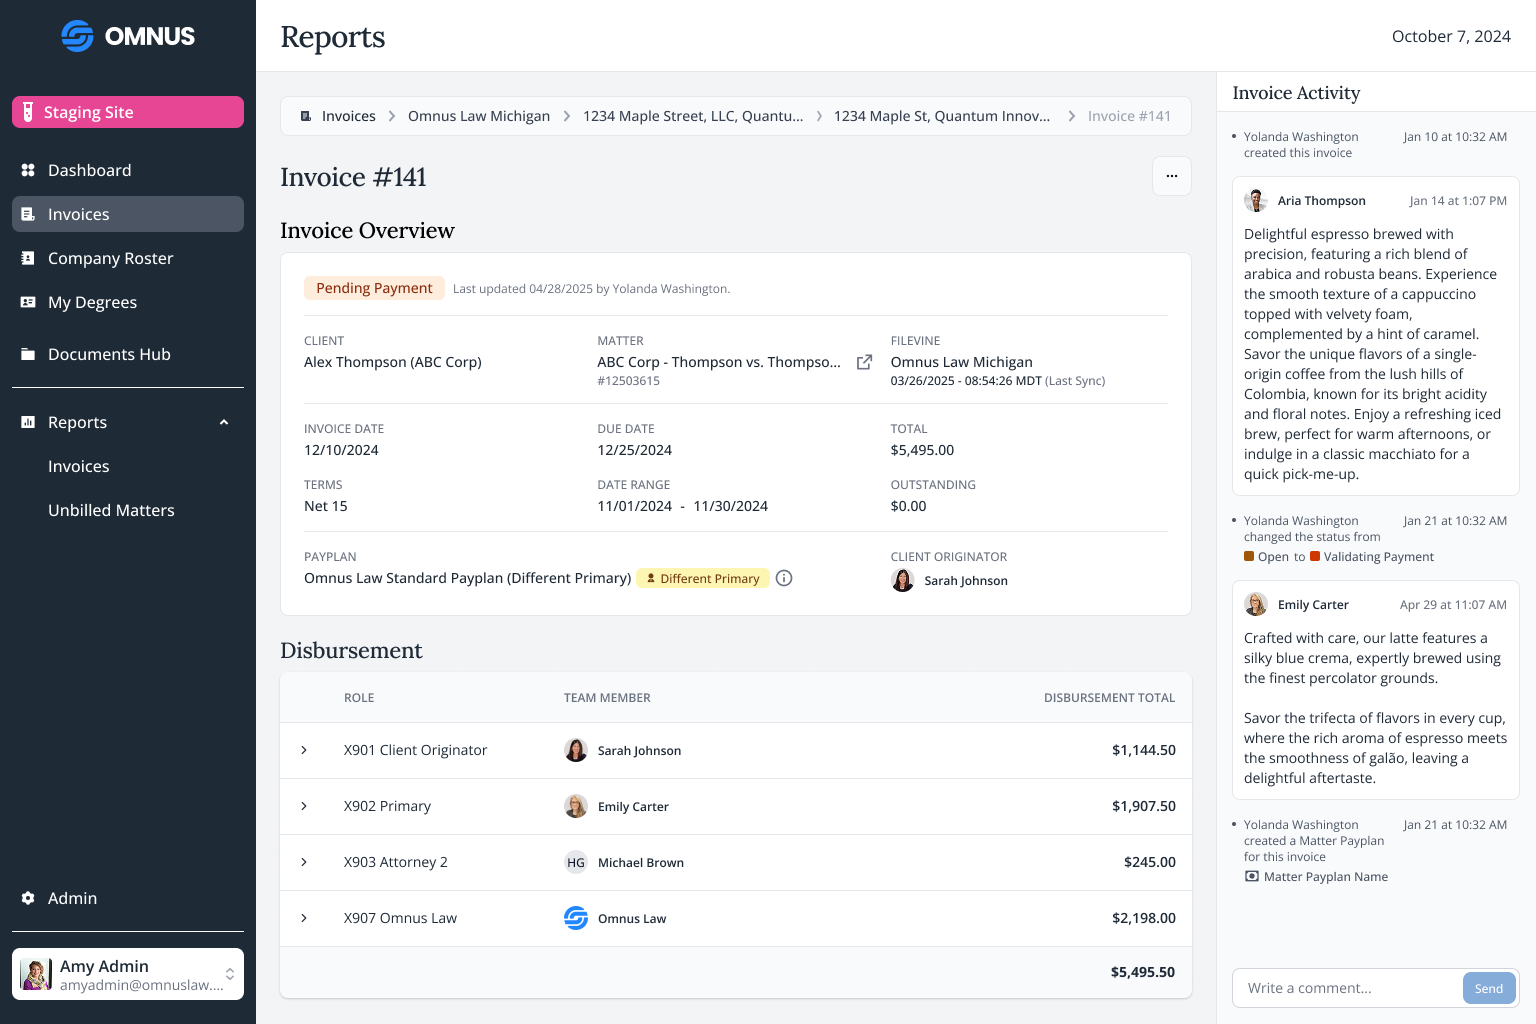
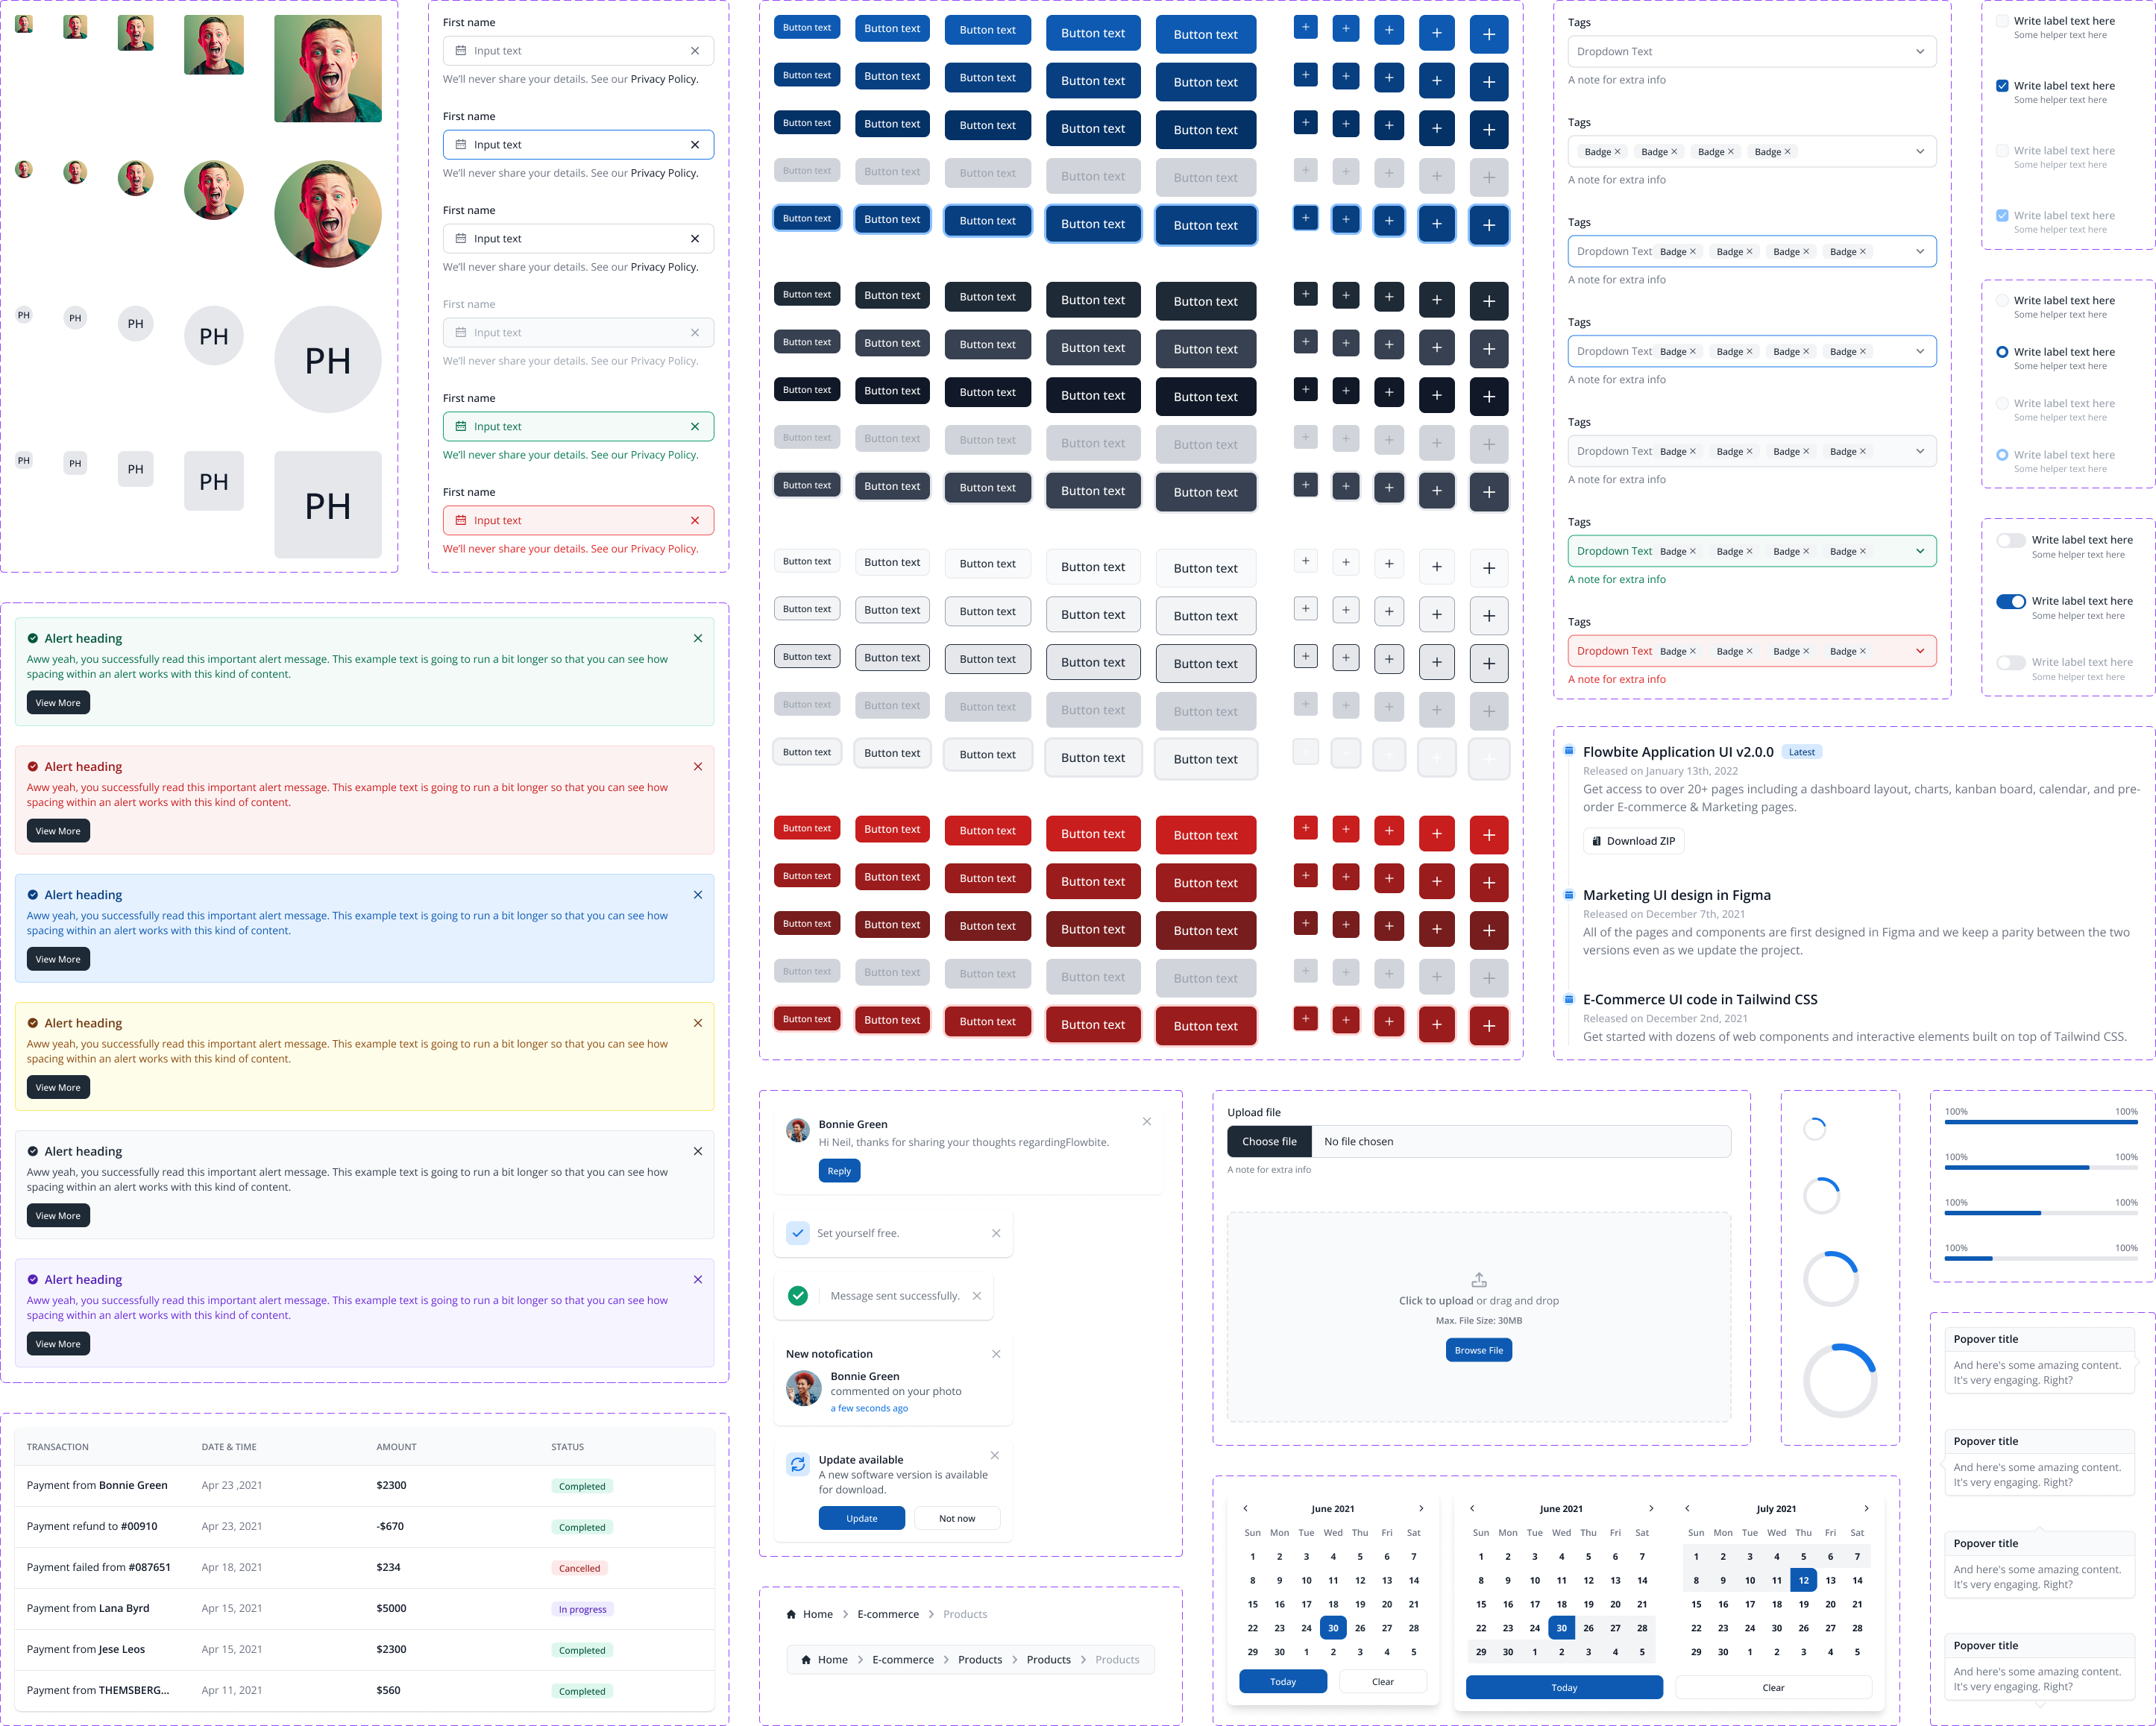
Early wireframes explored consolidating client, timesheet, and disbursement data on a single Invoice page.
The design evolved around


(rather than placeholders)
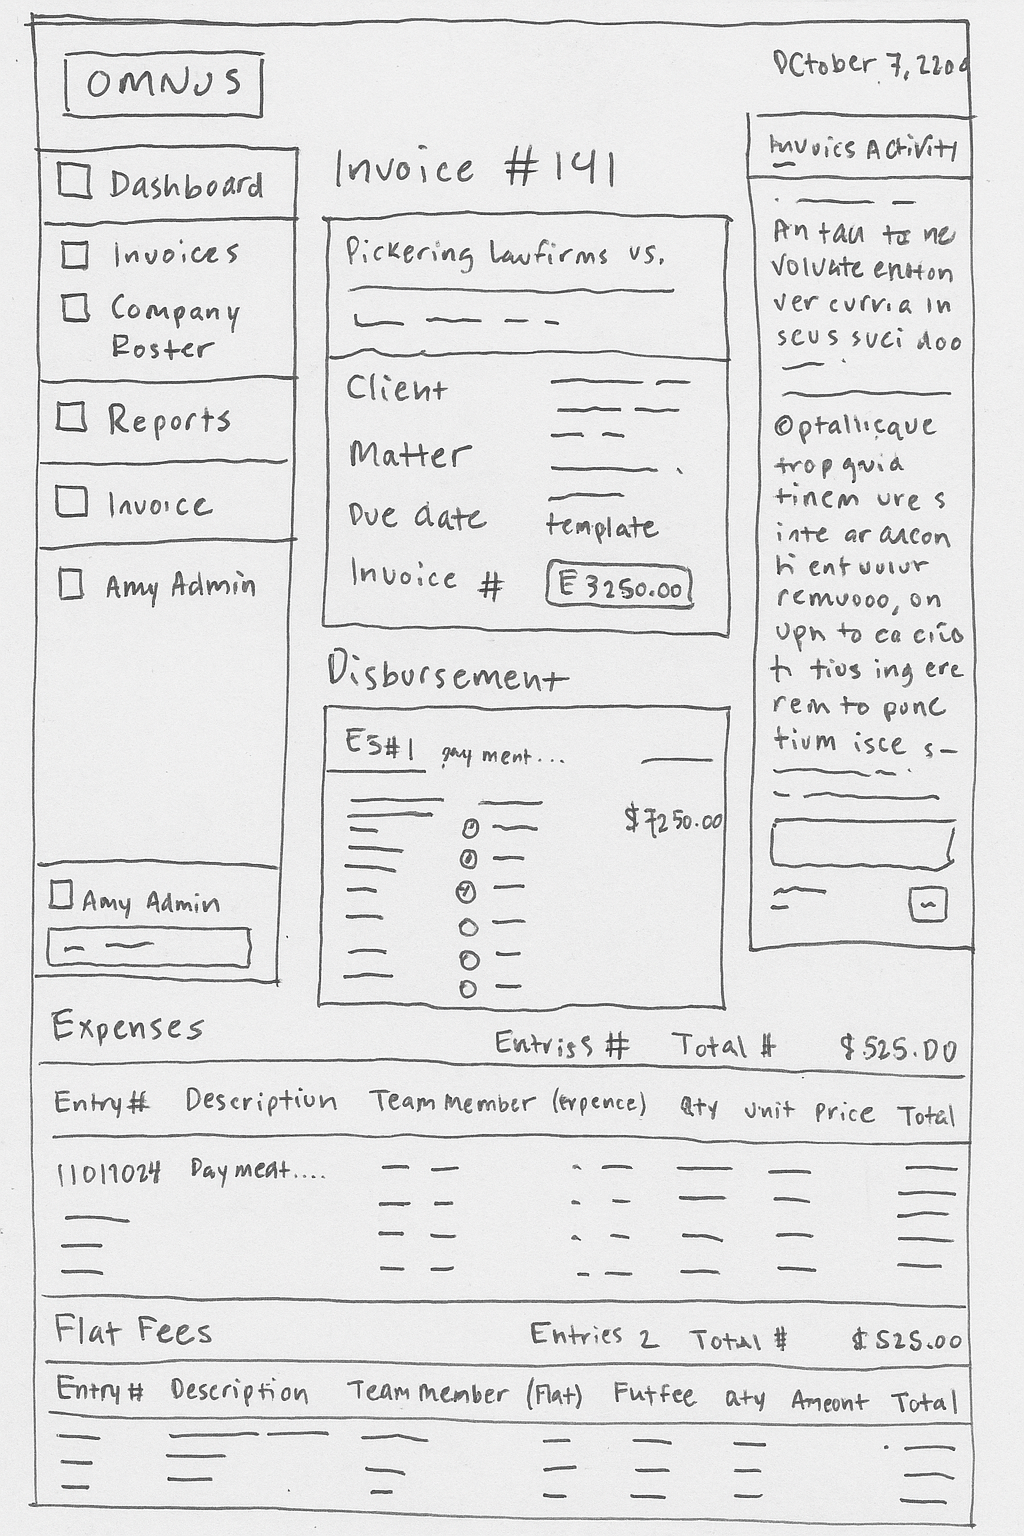
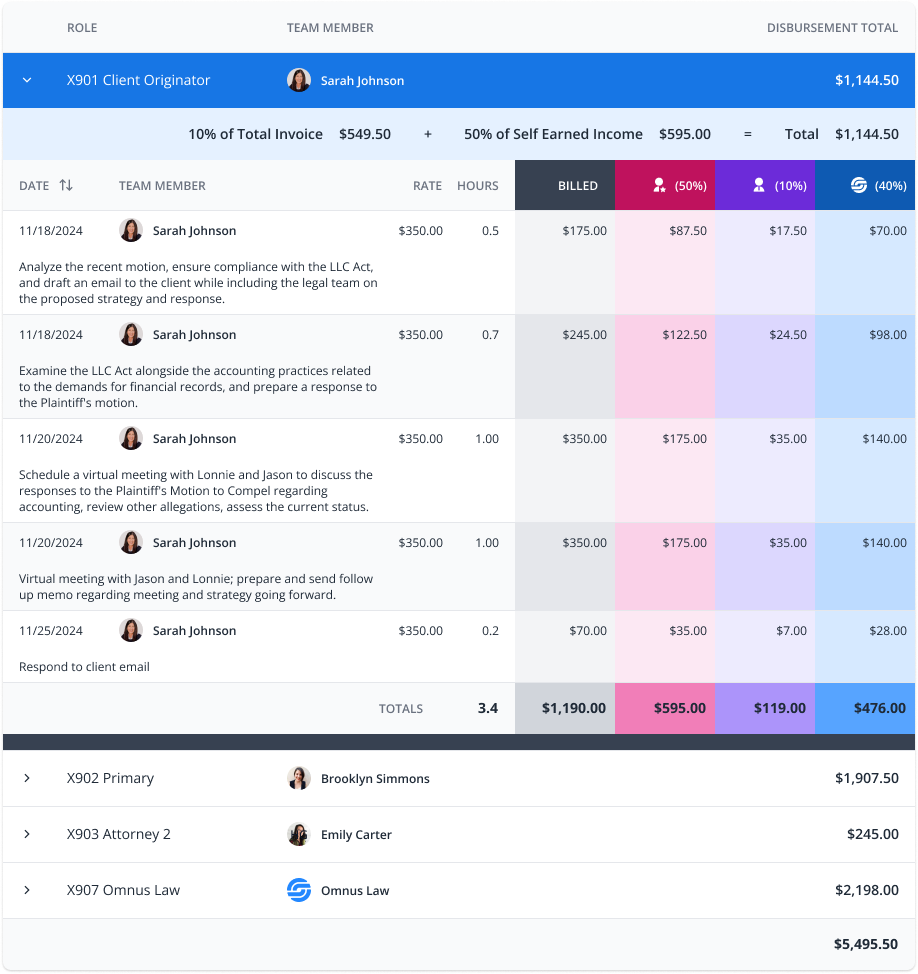
Invoice Summary
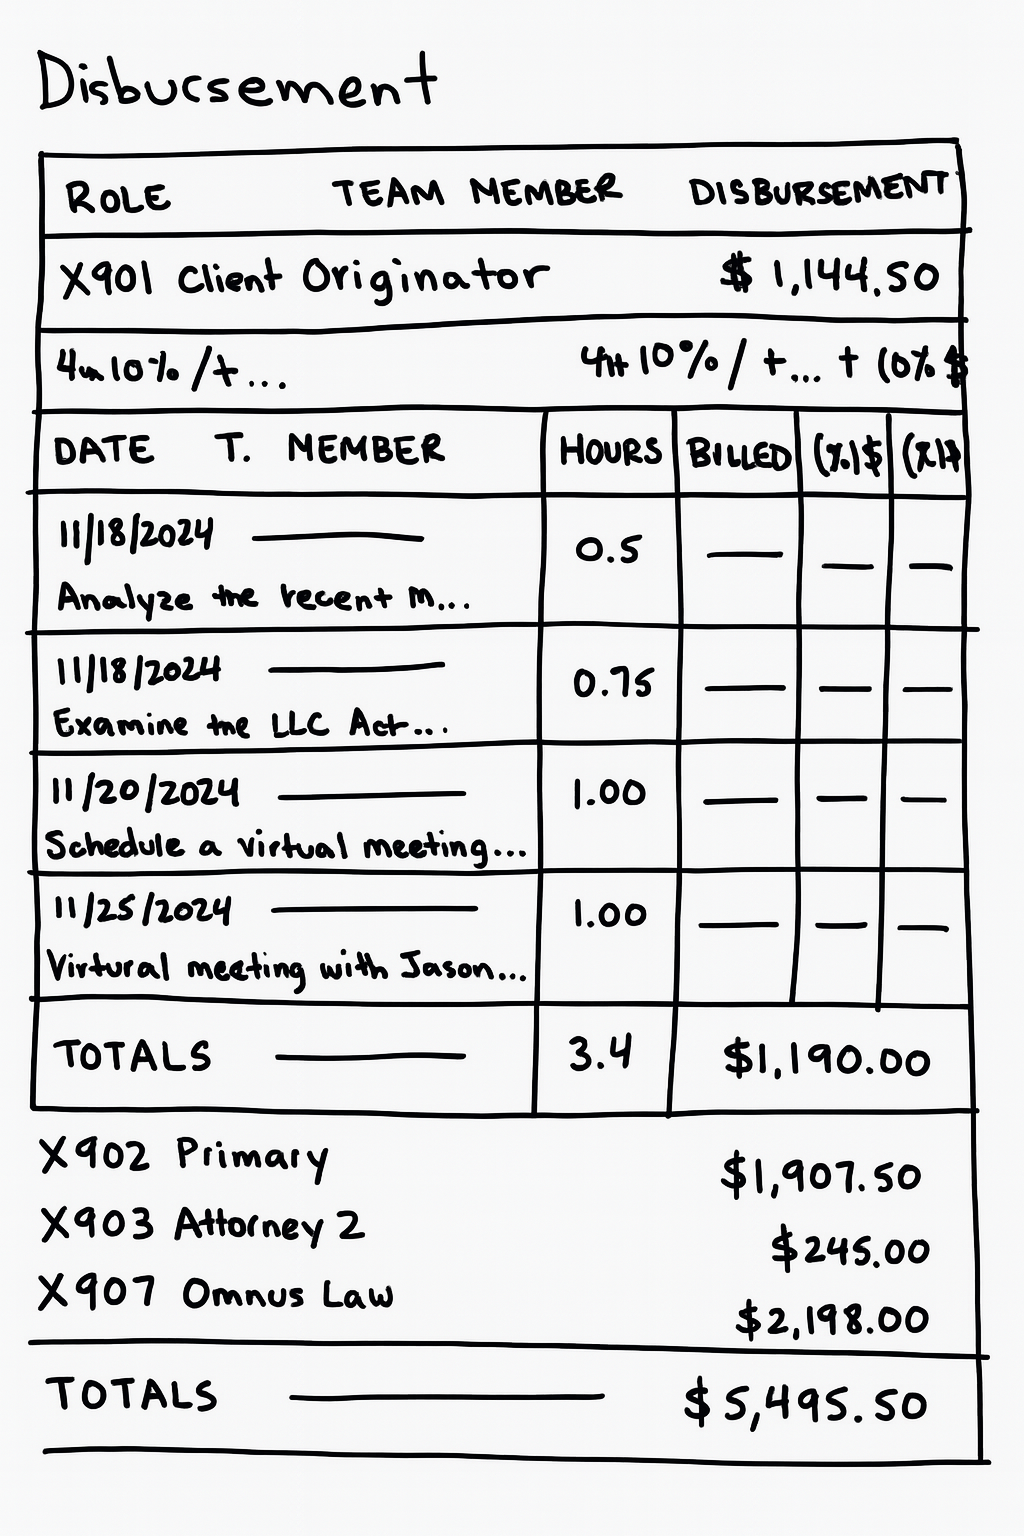
Disbursement View


Observed Finance Team members navigating interactive prototypes with minimal guidance to evaluate intuitiveness.


A.C. Ivory
UX Designer

Contact Me
Project Overview

Omnus Law’s Finance Team managed payouts for hundreds of attorneys using 50 separate Filevine accounts—exporting CSVs and wrangling spreadsheets for hours daily. I led the design of a unified Invoice & Partner Pool Dashboard that automated these processes and centralized data into a single, accurate ERP-style interface.
Omnus Law
Legal Sector
Oct 2024–May 2025
Sole UX Designer
Cross-functional partnership between Engineering, Finance, and Operations


Problems
Goals

50 Accounts


1 Dashboard

3-4 hrs/day

~0.5 hr/day

Frequent Errors

Automated Checks


Spreadsheet for maintaining 50 Filevine accounts.
This confirmed the need for a centralized data source and automated payout logic.

Early wireframes explored consolidating client, timesheet, and disbursement data on a single Invoice page.
The design evolved around


(rather than placeholders)
Invoice Summary
Disbursement View


Observed Finance Team members navigating interactive prototypes with minimal guidance to evaluate intuitiveness.

Metric
Before
After
Improvement
Manual processing time
2-4 hrs/day
< 1 hr/day
75-78% faster
Calculation errors
Frequent
Minimal
Near-zero discrepancies
User confidence
Low
High
Finance team “green-lighted” implementation


A.C. Ivory
UX Designer
Contact Me
Project Overview

Omnus Law’s Finance Team managed payouts for hundreds of attorneys using 50 separate Filevine accounts—exporting CSVs and wrangling spreadsheets for hours daily. I led the design of a unified Invoice & Partner Pool Dashboard that automated these processes and centralized data into a single, accurate ERP-style interface.
Omnus Law
Legal Sector
Oct 2024 - Apr 2025
Sole UX Designer
Cross-functional partnership between Engineering, Finance, and Operations


Problems
Goals
50 Accounts
1 Dashboard
3-4 hrs/day
~0.5 hr/day
Frequent Errors
Automated Checks


Spreadsheet for maintaining 50 Filevine accounts.
This confirmed the need for a centralized data source and automated payout logic.

Early wireframes explored consolidating client, timesheet, and disbursement data on a single Invoice page.
The design evolved around


(rather than placeholders)
Invoice Summary
Disbursement View


Observed Finance Team members navigating interactive prototypes with minimal guidance to evaluate intuitiveness.

Metric
Before
After
Improvement
Manual processing time
2-4 hrs/day
< 1 hr/day
75-78% faster
Calculation errors
Frequent
Minimal
Near-zero discrepancies
User confidence
Low
High
Finance team “green-lighted” implementation

A.C. Ivory
UX Designer